

Is Automation Costing You Customers?
The restaurant industry is in danger of fully engineering the humanity out of the guest experience. And guests are pushing back.
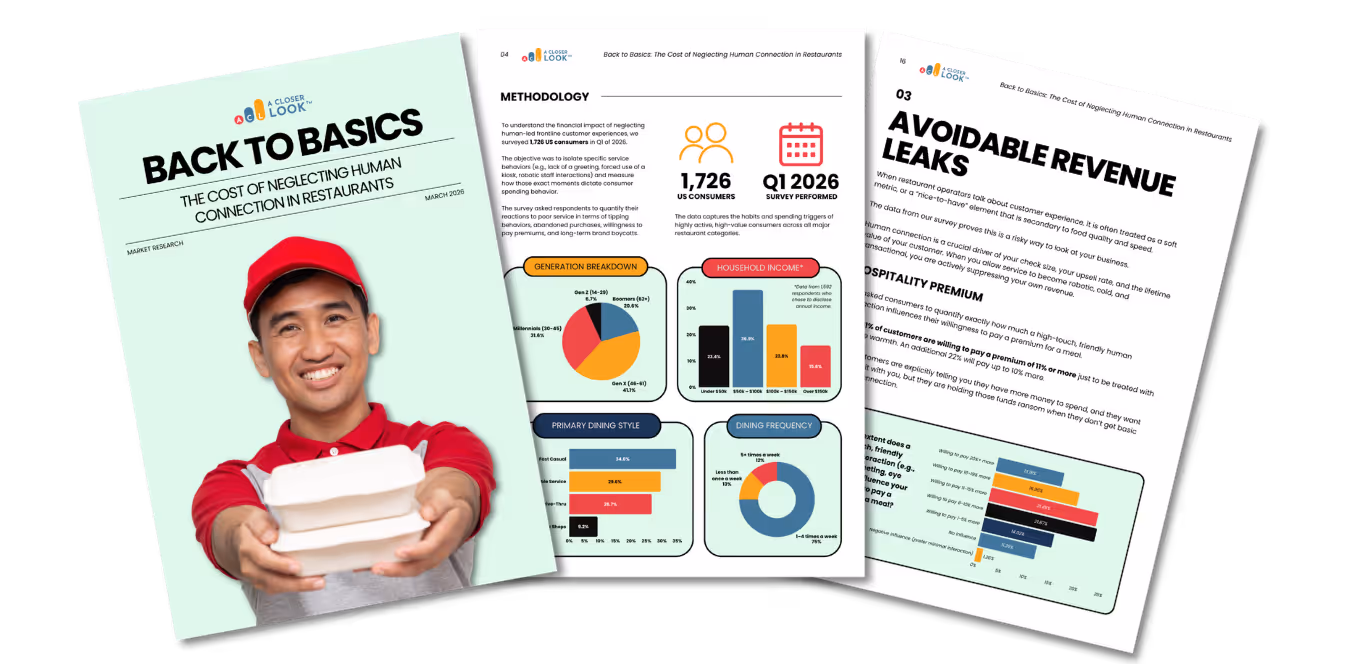
We surveyed 1,726 US consumers to reveal the hidden financial penalty of replacing human connection with hyper-efficiency and technology.


Your Dashboards Don't Tell the Full Story
You know your drive-thru times down to the second. But do you know how many customers are permanently abandoning your brand because the service feels robotic and cold?
Back to Basics: The Cost of Neglecting Human Connection in Restaurants proves that basic hospitality is a core economic engine of your business.
The 37% Walk-Away Rate
Why a distracted frontline is causing immediate, unmeasured daily revenue loss before the transaction even begins.
The "Veto Vote"
Why 57% of consumers will permanently blacklist your brand over bad service, even if they love your food.
Speed vs. Connection
Why 69% of your customers actually want you to slow down operations to deliver better, personalized hospitality
Tech Anxiety
How the forced use of kiosks and AI systems is artificially shrinking the addressable market, with nearly 50% of consumers actively avoiding highly automated locations.
The Upsell Engine
How friendly, energetic staff directly increases high-margin add-on orders (drinks, desserts) for over 60% of consumers.
...And Much More
This is an unmissible 22-page report with groundbreaking data on restaurant consumer trends. Get it today.

Download the Free PDF Report
Please fill out your details below to get access.

Frequently Asked Questions
We’ve compiled a list of the most frequently asked questions to help you get the information you need.
This data is essential for Restaurant CEOs, COOs, VPs of Operations, and Customer Experience Directors who want to plug operational revenue leaks and drive immediate growth in QSR, Fast Casual, and Full-Service environments.
A Closer Look surveyed 1,726 highly active US consumers in Q1 of 2026. The data tracks spending habits, tipping behaviors, technology friction, and brand loyalty across Gen Z, Millennials, Gen X, and Boomers.
A Closer Look provides premier mystery shopping and customer experience auditing for the restaurant industry. We know that traditional operational metrics (like ticket times and app adoption rates) fail to measure emotional connection. We published this report to prove that measuring the human element of your business is the only way to protect your bottom line.
Can’t find the answer you’re looking for? Please chat to our friendly team.